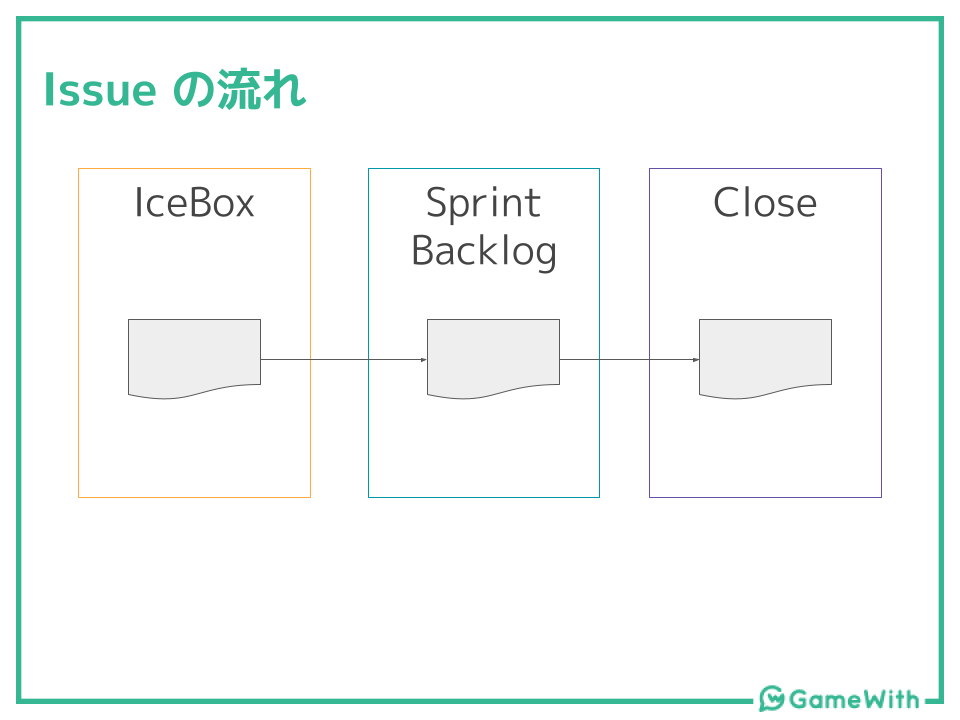
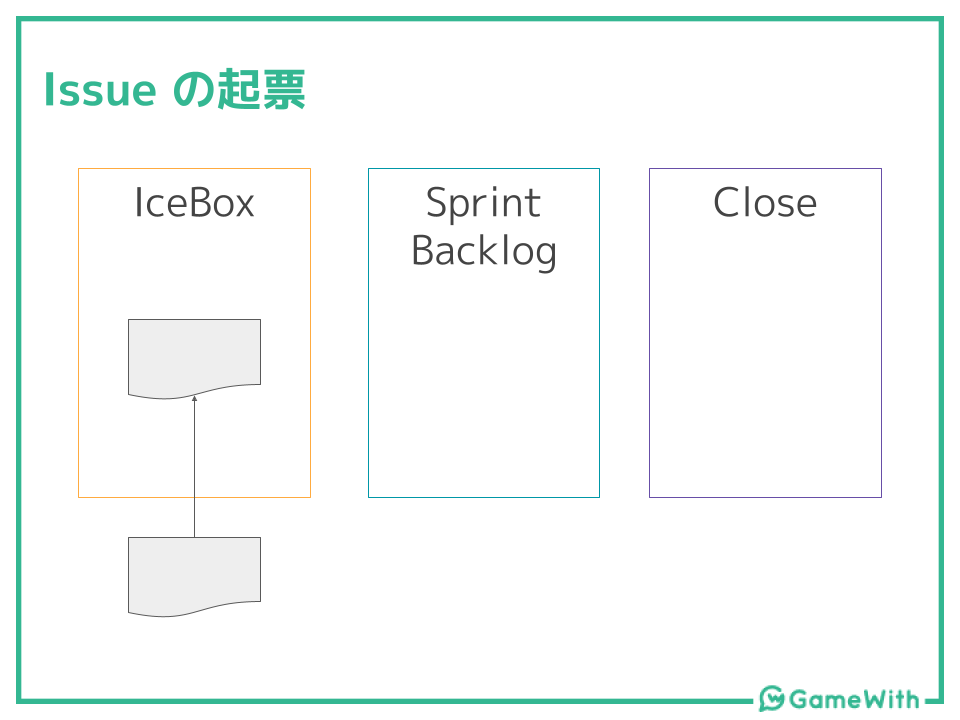
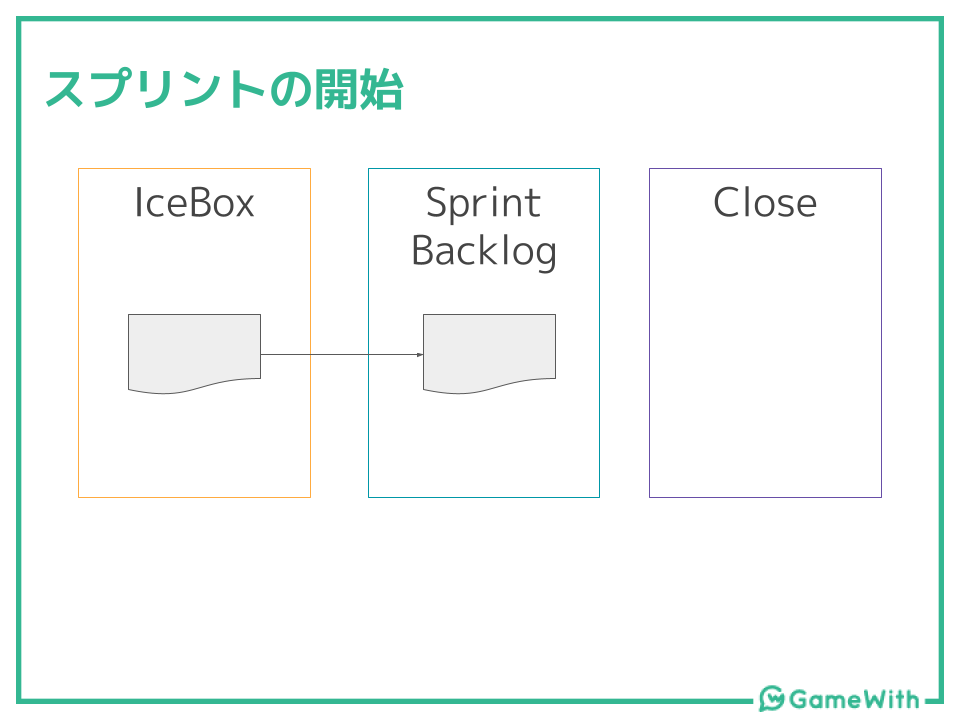
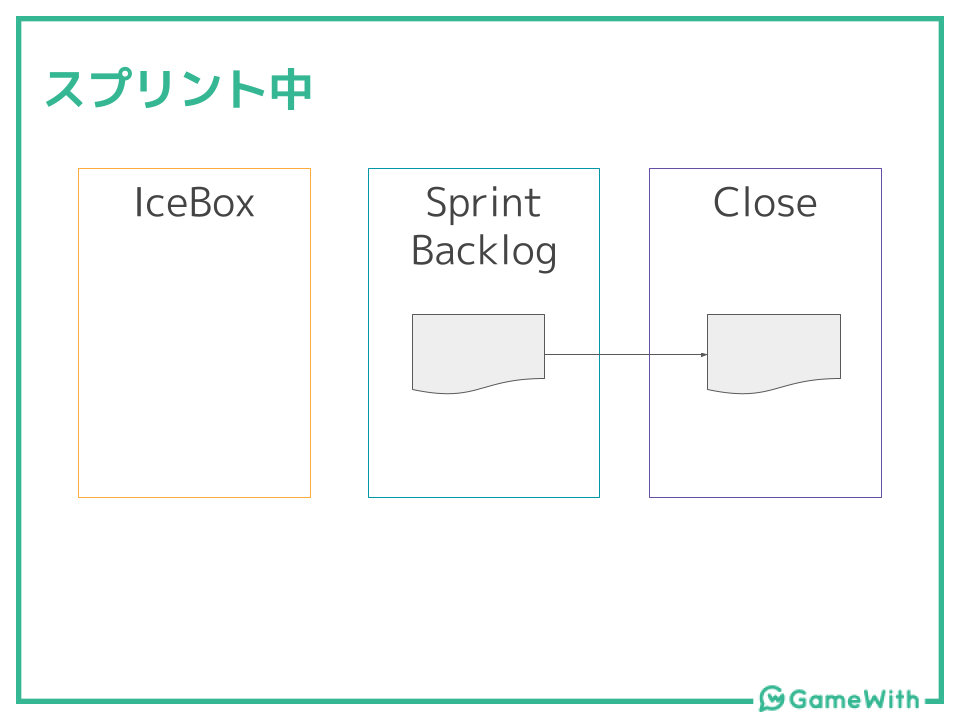
こんにちは。GameWith のエンジニアの tiwu です! 今回は自分が所属する開発チームの開発速度・パフォーマンスを可視化してみたので、利用技術など解説していこうと思います! まず、簡単にチームの紹介をしたいと思います。 自分が所属しているチームは1週間のスプリント開発を、GitHub + ZenHub を利用して行っています。 起票された Issue は下記の図のように、起票から完了まで流れていきます。 ※IceBox, Sprint Backlog, Close は ZenHub の Pipeline 名です ※途中に In Progress などがありますが省略しています 月曜日に新規案件共有会があり、Issue が起票され IceBox に移動します。 火曜日がスプリントの開始なので、IceBox から Sprint Backlog に移動させます。 スプリント中に対応が終わった Issue は Sprint Backlog から Close に移動させます。 「LeanとDevOpsの科学」を参考に下記2つを計測していきたいと思います。
はじめに
開発チームの紹介
計測
![LeanとDevOpsの科学[Accelerate] テクノロジーの戦略的活用が組織変革を加速する impress top gearシリーズ](https://m.media-amazon.com/images/I/51TuqLnPBCL._SL500_.jpg "LeanとDevOpsの科学[Accelerate] テクノロジーの戦略的活用が組織変革を加速する impress top gearシリーズ")
デプロイ頻度
スプリント中に対応が完了した Issue の数を計測しようと思います。
Issue != デプロイ数ではありますが、いったん Issue 数で定義しました。
スプリントを GitHub のマイルストーンを利用し管理しているので、マイルストーンに紐づくクローズされた Issue の数がデプロイ頻度となります。
変更のリードタイム
これは2段階に分けて計測をしていきます。
IceBox ~ Sprint Backlog
まずは IceBox ~ Sprint Backlog の移動時間です。
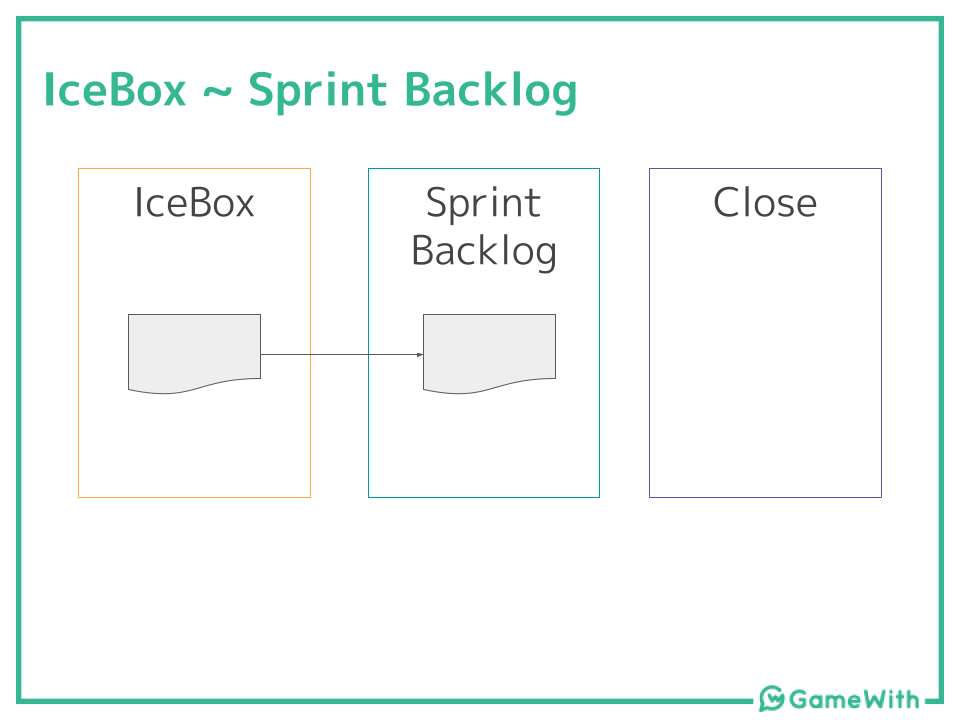
この時間が長ければ長いほど起票されてから開発着手まで時間がかかったことがわかります。
起票の日時は GitHub API を利用することで取得することが出来ます。
Sprint Backlog への移動日時は ZenHub API を利用することで取得することが出来ます。
Sprint Backlog ~ Close
次に Sprint Backlog ~ Close の移動時間です。
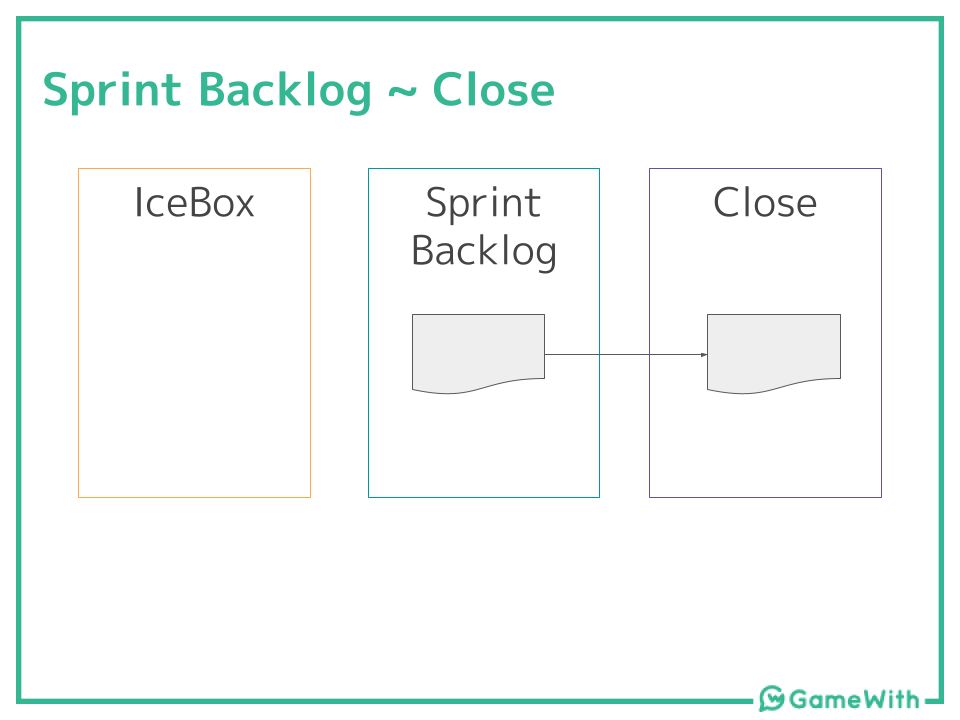
1週間スプリントで動いているため、この時間が1週間以上のタスクはスプリント内に終わらなかったことがわかります。
Close された日時は GitHub API を利用することで取得することが出来ます。
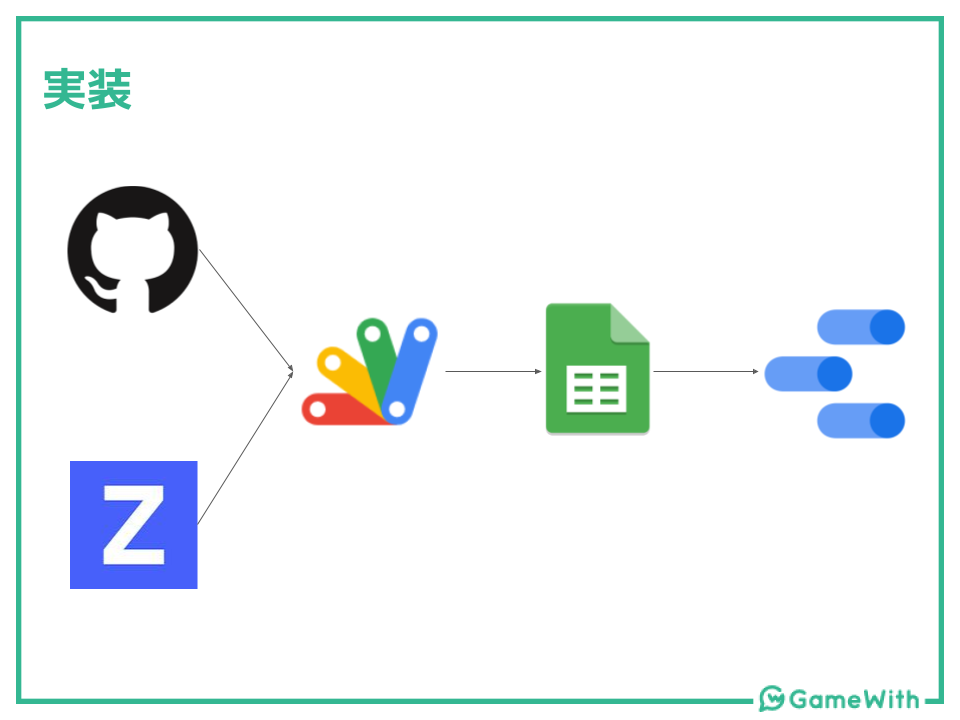
実装
GAS 経由で GitHub API, ZenHub API を利用しデータを取得し、SpreadSheet に保存します。
データの可視化は DataStudio を利用します。
GitHub API
まず、マイルストーンに紐づくクローズされた Issue を取得します。
Issue 取得 API のmilestone と state パラメーターを利用して取得します。
const response = await fetch('https://api.github.com/repos/${owner}/${repo}/issues?milestone=${milestone_number}&state=closed', {
  headers: {
    'Authorization': 'token ${token}'
  },
});
次に Issue の起票日とクローズ日ですが、これは Issue 取得 API のレスポンスに created_at, closed_at が含まれているためこれを利用します。
ZenHub API
ZenHub の Sprint Backlog への移動は、Events API を利用することで取得できます。
const response = await fetch('https://api.zenhub.io/p1/repositories/${repo_id}/issues/${issue_number}/events?access_token=${token}');
レスポンスは下記のようになっており(公式から)、type = transferIssue イベントの to_pipeline = Sprint Backlog となっている日時が今回計測に使う日時になります。
[
  {
    "user_id": 16717,
    "type": "estimateIssue",
    "created_at": "2015-12-11T19:43:22.296Z",
    "from_estimate": {
      "value": 8
    }
  },
  {
    "user_id": 16717,
    "type": "estimateIssue",
    "created_at": "2015-12-11T18:43:22.296Z",
    "from_estimate": {
      "value": 4
    },
    "to_estimate": {
      "value": 8
    }
  },
  {
    "user_id": 16717,
    "type": "estimateIssue",
    "created_at": "2015-12-11T13:43:22.296Z",
    "to_estimate": {
      "value": 4
    }
  },
  {
    "user_id": 16717,
    "type": "transferIssue",
    "created_at": "2015-12-11T12:43:22.296Z",
    "from_pipeline": {
      "name": "Backlog"
    },
    "to_pipeline": {
      "name": "In progress"
    },
    "workspace_id": "5d0a7a9741fd098f6b7f58ac"
  },
  {
    "user_id": 16717,
    "type": "transferIssue",
    "created_at": "2015-12-11T11:43:22.296Z",
    "to_pipeline": {
      "name": "Backlog"
    }
  }
]
GAS
GAS では下記のような関数を作りデータを取得し、Spreadsheet に書き込みをします。
function setData(milestone, sheetName) {
  // シートの取得
  const sheet = SpreadsheetApp.openById('XXX').getSheetByName(sheetName);
  const lastRow = sheet.getLastRow();

  // マイルストーンに紐づく Issue を取得
  const response = UrlFetchApp.fetch('https://api.github.com/repos/${owner}/${repo}/issues?milestone=${milestone}&state=closed', {
    headers: {
      'Authorization': 'token XXX'
    },
  });
  const issues = JSON.parse(response.getContentText());

  issues.forEach((issue, index) => {
    // issue 毎にイベント情報を取得
    const eventsResponse = UrlFetchApp.fetch('https://api.zenhub.io/p1/repositories/${repo_id}/issues/${issue.number}/events?access_token=XXX');
    const events = JSON.parse(eventsResponse.getContentText());

    let springBacklogDate = null;
    // 最新順に取得できるので、古い順からみる
    for (const event of events.reverse()) {
      if (event.type === 'transferIssue' && event.to_pipeline.name === 'Sprint Backlog') {
        springBacklogDate = new Date(event.created_at);
        break;
      }
    }

    created_at = new Date(issue.created_at);
    closed_at = new Date(issue.closed_at);

    const row = lastRow + index + 1;
    sheet.getRange(row, 1).setValue(issue.title);
    // 起票日
    sheet.getRange(row, 2).setValue(Utilities.formatDate(created_at, 'Asia/Tokyo', 'yyyy-MM-dd HH:mm:ss'));
    // Sprint Backlog 移動日
    sheet.getRange(row, 3).setValue(Utilities.formatDate(springBacklogDate, 'Asia/Tokyo', 'yyyy-MM-dd HH:mm:ss'));
    // クローズ日
    sheet.getRange(row, 4).setValue(Utilities.formatDate(closed_at, 'Asia/Tokyo', 'yyyy-MM-dd HH:mm:ss'));
    // IceBox ~ Sprint Backlog
    sheet.getRange(row, 5).setValue(parseInt((springBacklogDate - created_at) / 1000)); // 秒
    // Sprint Backlog ~ Close
    sheet.getRange(row, 6).setValue(parseInt((closed_at - springBacklogDate) / 1000)); // 秒
  });
}
GAS には JS のように fetch 関数はないため UrlFetchApp を利用して、外部の API を叩きます。
また、JSON で取得することは出来ないため、getContentText 後に JSON.parse をする必要があるます。
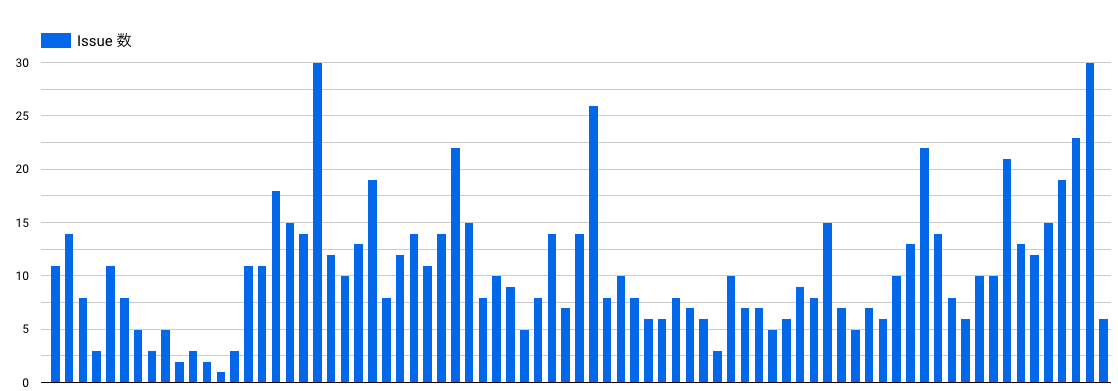
DataStudio
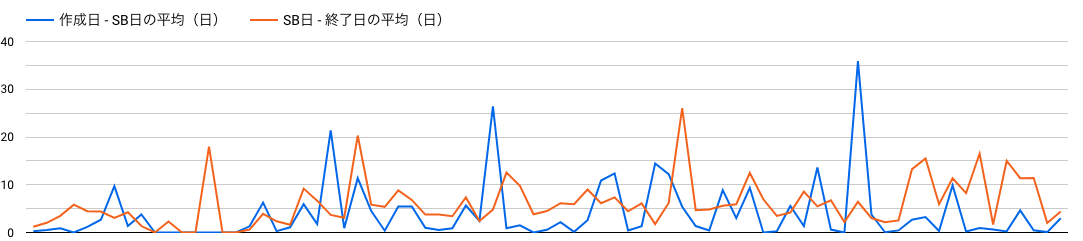
DataStudio ではシンプルに棒グラフと折れ線グラフを作りました。
Issue 数は安定して 7.5 ほど対応できています(たまに20を超えることも)
案件の速度は平均を取ってみました。
IceBox ~ Sprint Backlog はたまに平均 20オーバーの時もあり、起票後着手まで時間がかかった案件があることがわかります。
Sprint Backlog ~ Close に関しては、7日を超えたり越えなかったり。
終わりに
今回は平均を取ってみましたが、中央値を取るべきかなどなど改善すべき箇所が他にもありそうです。
また、計測して終わりではなく BML ループのように学び・次に活かすループを回していこうと思います!
Twitter にてテックブログの投稿をツイートしていますので、よろしければフォローをお願いします!
Tweets by gamewith_dev twitter.com
Wanted!
一緒に働く仲間(特にサーバサイドエンジニア)を絶賛募集中です! 以下 Wantedly のページからぜひカジュアル面談へお申し込みください!